EPSN
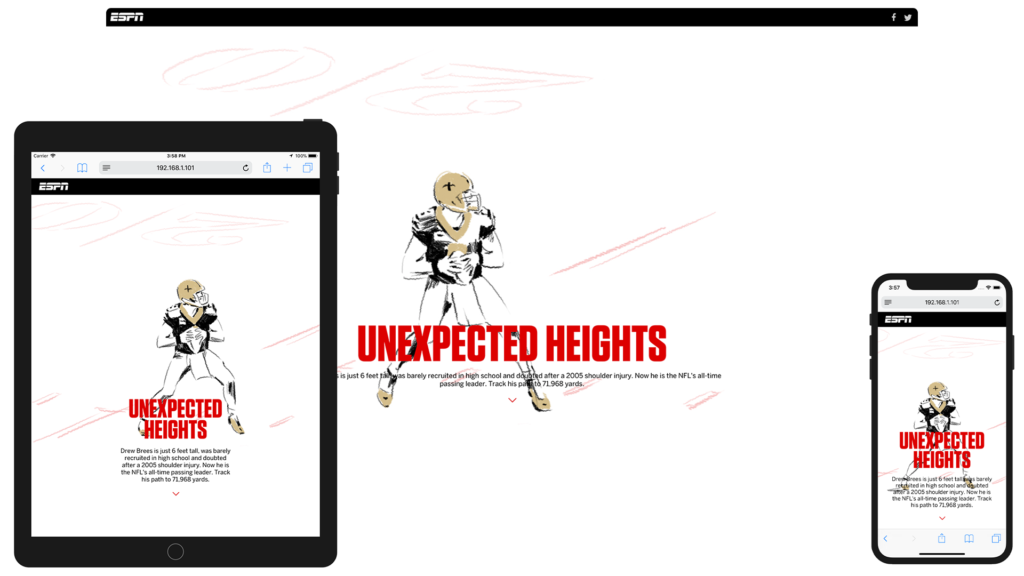
Unexpected Heights
The Saints QB is now the all-time passing yards leader in NFL history. ESPN tracked his path to 71,968 yards.
Background
ESPN
As Drew Brees approached the record, EPSN wanted to feature a timeline of this achievement, starting as far back in his career as November 4th, 2001 up to the 62-yard touchdown pass to rookie receiver Tre’Quan Smith on December 19th, 2019
Content
The Creative
The team at ESPN handed off a sketch file with mobile & desktop designs, fantastic illustrations and animations by Iveta Karpathyova, and an HTML wrapper file for me to use.
The Distance
Yardage Counter
As the user scrolls down the the site, the counter updates Drew’s total yards to date and how many quarterbacks are ahead of his current yardage.
_instance = {n : 0};

scrollUpdate = (scrollPos, skipAnimation) => {
    const els = [...document.querySelectorAll('['+attr+']')];
    let count = 0;
    els.forEach(el => {
        const top = el.getBoundingClientRect().top;
        if(top < scrollPos) {
            count = Number(el.getAttribute(attr));
        }
    });
    if(skipAnimation){
      el.innerHTML = getCounterString(count);
      n = count;
      return;
    }
    TweenLite.to(_instance, .6, {
      n: count,
      ease: Quad.easeOut,
      onUpdate: function() {
        el.innerHTML = getCounterString(_instance.n);
      },
      onUpdateScope:this
    });
  };
// plot data
var plot = function(data, color) {
var px,py;
data.forEach(function(value, index){
x = (index+1) * inc + origin.x;
y = origin.y - value/80 * graph.height;
_svg.paper.circle(x, y, 3).attr({
fill: color
});
if(px && py) {
_svg.paper.line(px,py,x,y).attr({
'font-family':"BentonSans-Medium, BentonSans",
'font-size':"13",
'font-weight':"400",
'letter-spacing':"0.6",
fill:"#9B9B9B",
stroke: color,
'stroke-width': 2
});
}
px = x;
py = y;
})
};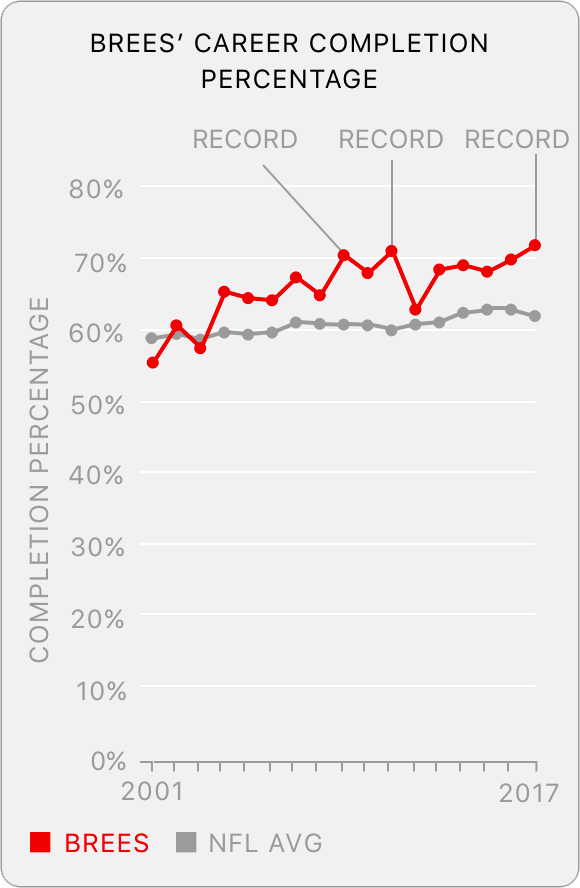
Data Visualizations
Snap.svg
A challenge while in development was that the data was always changing as Drew played each game. Therefore, we couldn’t create static data visualizations, and after each game ESPN would supply me with new numbers. As a result, I used the javascript library, snap.svg, to dynamically create the graphs.
The Tech
Loading up the toolbox
I am a huge fan of GSAP all the way back from the days of Flash. With the exception of using GSAP and Snap.svg the rest of the technologies used were standard: HTML5, SCSS, Webpack, and JSON for data-modeling.
Considerations and Recommendations
As a freelancer, you wear many hats. As project manager, I chose tools that help the team organize tasks and assets. For ESPN, I recommended Trello and created a board that borrows features from agile planning. This provides visibility to the client for the work that is outstanding, in development and completed.
Google Sheets
JSON
Nunjucks
HTML5
FEED ME!
Content Management
ESPN has their own CMS to handle article content, however developers do not have access to it. In order to get the copy deck into HTML markup, the content team at ESPN edits a google sheet, then I export it to JSON, and use that to compile the markup (via Nunjucks). When updates are required, the team makes the changes in google sheets, and I export a fresh JSON file, compile it and then they can copy & paste the markup into their CMS.
The Team
Associate Art Director –– Sarah Pezzullo
Reporting –– Mike Triplett
Sr. Designer –– Titus Smith
Developer –– Chad Drobish